Score interpretation
Comprehensive guidelines to help interpret results for each MCC exam.
Comprehensive guidelines have been developed to help interpret the results for each Medical Council of Canada (MCC) exam. For each exam, general guidelines are provided first, followed by specific guidelines for each exam.
When interpreting a score from an MCC exam, consider the purpose, level of knowledge, skills assessed, and intended use of the exam. Secondary use of exam results should be exercised with caution and be in line with the exam’s purpose. No assessment tool is designed for all purposes. Selection decisions should not be based on a single assessment tool. To obtain a comprehensive view of a candidate’s qualifications, we recommend that MCC exam results be used in conjunction with other sources of information (e.g., results from another MCC exam, medical school transcripts, reference letter, other credentials, etc.).
All MCC exams are criterion-referenced, which means the pass or fail result is determined by comparing an individual candidate’s score to a standard (as reflected by the pass score) regardless of how others perform. Passing means the candidate has achieved the level of knowledge, skills, and attitudes targeted by the exam.
Each exam has a score scale with a specific range, a mean, and a standard deviation (SD). Score comparisons across time are best made by looking at how far a score is relative to the pass score implemented at the time. This also applies to comparing scores when there are changes to score scales over time. As an example, a Medical Council of Canada Qualifying Examination (MCCQE) Part I score of 256 on the 100 to 400 scale, in place as of 2018, with a mean of 250 and SD of 30 is one (SD) above the pass score of 226. An MCCQE Part I score of 527 on the former 50 to 950 scale with a mean of 500 and a SD of 100 is one 1 SD above the pass score of 427 from spring 2015. These two scores represent similar performance. For more examples, check out our results interpretation charts for each exam on this page (Tables 1–3).
The MCC cautions against comparing candidates based on small total score differences. The total score is designed to be most precise around the pass score to support a reliable pass/fail decision. Total scores are not designed to provide score precision along a wide range of the score scale. Small score differences should not be overinterpreted because they may fall within the range of values that might reasonably arise because of measurement error.
Subscores for the MCCQE Part I are reported on the same scale as the total and so are comparable across exam forms and sessions. However, for the NAC Examination, subscores are reported on a different scale than the total score and are thus not comparable across examination forms or sessions.
Use total scores rather than subscores. Based on significantly less data, subscores are not as reliable as total scores and should not be used to compare candidate performances. Subscores are provided to candidates as formative feedback on their relative strengths and weaknesses in various competency areas.
For each exam, candidates may see a different set of questions or clinical cases than other candidates taking the same exam during the same session. These different versions or “forms” of the exams are offered for quality assurance purposes. Great care is taken when assembling these forms to ensure they meet all test specifications and are each as comparable to each other as possible.
Additionally, psychometric analyses and procedures are performed postexam to adjust for slight differences in difficulty across forms. These are known as “equating” and “linking,” which allows the comparison of scores over time across forms and sessions.
The National Assessment Collaboration (NAC) Examination assesses the readiness of international medical graduates (IMG) for entry into a Canadian residency program, regardless of where they pursued their undergraduate education. It is a one-day examination that consists of 10 operational Objective Structured Clinical Examination (OSCE) stations (prior to September 2020, 10 operational stations and two pilot stations). Psychometric results are reviewed by subject matter experts after each exam session and items or stations may be removed from scoring due to procedural irregularities or content issues.
The exam is designed to assess the knowledge, skills, and attitudes at the level expected of a recent Canadian medical graduate for entry into supervised clinical practice in a postgraduate training program. The exam is based on the MCC Examination Objectives, which are organized under the CanMEDS roles.
Each candidate who challenges the NAC Examination receives two score reports – a Statement of Results (SOR) and a Supplemental Information Report (SIR). The SOR provides the candidate with their total score, the pass score, and their final result (i.e., pass, fail). The SIR provides the candidate with subscores in graphical format for the competency domains assessed by the exam.
Of note, the pass score on the NAC Examination is intended to screen IMGs who are not ready for entry into a residency program, and therefore, it is expected that the pass score is below the ability of IMGs seeking entry into a practice-ready assessment (PRA) program. For purposes other than resident selection (e.g., PRA programs), it is appropriate to consider MCCQE Part II results (if available) before NAC Examination results as the former targets a higher level of clinical skills. Please note the MCCQE Part II has been discontinued due to exam delivery challenges during the COVID-19 pandemic.
The NAC Examination was delivered in person in May 2023 with the relaxing of some COVID-19 safety protocols (e.g., physical examinations were reintroduced). No change has been made to the exam blueprint implemented since March 2019.
For May 2023 onward, the total score was reported on a scale ranging from 500 to 700. For the May 2023 NAC Examination, there was a mean of 600 and a SD of 25. The pass score is 577 on this scale, and it was established by using an overall rating scale on each of the 10 operational stations to calculate the cut score by station, then averaged across the 10 stations. Because of these changes, total scores obtained starting at the May 2023 session will not be directly comparable with total scores from previous exam sessions.
Please note, the NAC Examination results were reported differently in September 2020. No total score or subscores were reported and only three categories of results were reported: pass, fail, pass with superior performance. That was a one-time measure for the exam administered under the circumstances at the time.
Due to changes to the exam, the MCC reported scores and pass scores on different scales over time. Table 1 describes the score scale, mean, SD and the pass score for the NAC Examination that were implemented for different sets of exam sessions. The first column (Exam session) indicates different sets of exam sessions for each scale (e.g., March 2019-March 2020). The second column (score range) indicates the minimum and maximum total score for the set of exam sessions. The third and fourth columns indicate the mean, SD, and pass score for the scale. The mean and SD were established using the candidate performance data at the time the scale was first implemented. They may vary over time with subsequent exam sessions. The last three columns in Table 1 indicate how far a total score (in SD unit) is from the pass score established for a scale.
Within each set of exam sessions, the NAC Examination total scores are equated across examination forms using statistical procedures. As a result, total scores are comparable across test forms and sessions, and the same pass score is applied to candidates. However, scores cannot be directly compared between scales (e.g., between May 2023 and September 2020-September 2022). This is because the implementation of the NAC Examination differed over time due to changes made to either the content, format, scoring approach, or delivery mode.
Nonetheless, an indicator of relative performance can be computed by comparing total scores to the standard (i.e., the pass score) for the relevant period. As an example, a NAC Examination total score of 602 obtained in May 2023 represents similar, relative performance to a score of 1399 obtained between October 2021 and September 2022, and to a score of 423 obtained between March 2019-March 2020. They are both 1 SD above their respective pass score.
An indicator of relative performance has also been computed for the “pass with superior performance” category used in the September 2020 exam. It was determined that this category was approximately 1.8 SDs above the pass score.
In Table 1, a column shows the score for each of the exam sessions that is similar to the “pass with superior performance” category. As an example, a NAC Examination total score of 622 obtained in May 2023 represents similar, relative performance to a result of “pass with superior performance” obtained in September 2020. It also represents similar performance to a total score of 1419 obtained from October 2021 to September 2022, a total score of 443 obtained from March 2019 to March 2020 or a total score of 79 obtained from March 2013 to September 2018. They are all 1.8 SDs above their respective pass score.
Table 1. Score interpretation parameters for the NAC Examination
Exam session | Score range | Mean (SD) | Pass score | 1 SD above the pass score | 1.8 SDs above the pass scorea | 2 SDs above the pass score |
May 2023 onward | 500–700 | 600 (25) | 577 | 602 | 622 | 627 |
October 2021 September 2022 | 1300–1500 | 1400 (25) | 1374b | 1399 | 1419 | 1424 |
September 2020 | N/Ac |
|
|
|
|
|
March 2019 to March 2020 | 300–500 | 400 (25) | 398d | 423 | 443 | 448 |
March 2013 to September2018 | 0–100 | 70 (8) | 65e | 73 | 79 | 81 |
The MCCQE Part I is a summative examination that assesses the critical medical knowledge and clinical decision-making ability of a candidate at a level expected of a medical student who is completing his or her medical degree in Canada. The examination is based on the MCC Blueprint and on the MCC Examination Objectives, which are organized under the CanMEDS roles. It is a one-day computer-based examination that consists of 210 multiple-choice questions and 38 clinical decision-making cases that include short-menu and short-answer write-in questions. The exam includes pilot questions, also called pretest items, which could be included in scoring if they perform well psychometrically or after being reviewed by subject matter experts.
Candidates graduating and completing the MCCQE Part I normally enter supervised clinical practice. Passing means the candidate has demonstrated the knowledge, skills, and attitudes necessary as part of a requirement for medical licensure in Canada for entering supervised clinical practice.
Each candidate who challenges the MCCQE Part I receives two score reports—a SOR and a SIR. The SOR includes a total score, the pass score, and final result (e.g. pass, fail). The SIR provides the candidate with subscores in graphical format for the competency domains assessed by the exam.
For the MCCQE Part I, a new exam blueprint was implemented starting in April 2018, and changes were made to the structure of the content and the format of the exam. In addition, a new scale and pass score were established. The total score is reported on a scale ranging from 100 to 400 with a mean of 250 and an SD of 30 based on April 2018 results. The current pass score is 226 and was established by a panel of physician experts from across the country following a rigorous standard-setting exercise in June 2018.
Prior to 2018, the content was based on a different blueprint for the MCCQE Part I. The scale ranged from 50 to 950 with a mean of 500 and an SD of 100. The mean and SD were set using results from the spring 2015 session. Because the exams are different and based on different blueprints, scores obtained before 2018 cannot be directly compared with scores obtained in 2018 and beyond.
Due to changes to the exam, the MCC reported total scores and pass scores on different scales over time. Table 2 describes the score scale range, mean, SD and the pass score for the MCCQE Part I that were implemented for different sets of exam sessions. The first column (Exam session) indicates different sets of exam sessions for each scale (e.g., April 2018 and onward). The second column (score range) indicates the minimum and maximum total score for the set of exam sessions. The third and fourth columns indicate the mean, SD, and pass score for the set of exam sessions. The last two columns in Table 2 indicate how far a total score (in SD unit) is from the pass score established for a set of exam sessions. The mean and SD were established using the candidate performance data at the time the scale was first implemented. They may vary over time with subsequent exam sessions.
Within each set of exam sessions, the MCCQE Part I total scores are equated across test forms using statistical procedures. As a result, total scores are comparable across test forms and sessions, and the same pass score is applied to candidates. However, scores cannot be directly compared between each set of sessions (e.g., between April 2018 and onward and April 2015—November 2017). This is because the implementation of the MCCQE Part I differed over time due to changes made to either the content, format, scoring approach, or delivery mode. Nonetheless, an indicator of relative performance can be calculated by comparing total scores to the standard (i.e., pass score) for the relevant period. As an example, an MCCQE Part I total score of 256 obtained in April 2018 represents similar, relative performance to a score of 527 obtained in April 2015-November 2017. They are both 1 SD above their respective pass score.
Table 2. Score interpretation parameters for the MCCQE Part I
Exam session | Score range | Mean (SD) | Pass score | 1 SD above the pass score | 2 SDs above the pass score |
April 2018 onward | 100-400 | 250 (30) | 226a | 256 | 286 |
April 2015 to Nov. 2017 | 50-950 | 500 (100) | 427b | 527 | 627 |
The MCCQE Part II assessed the candidate’s core abilities to apply medical knowledge, demonstrate clinical skills, develop investigational, and therapeutic clinical plans, as well as demonstrated professional behaviours and attitudes at a level expected of a physician in independent practice in Canada. Based on the MCC Blueprint and the MCC Examination Objectives, the MCCQE Part II was a two-day examination that consisted of 12 OSCE stations. Candidates were presented with 8 stations on day 1 (Saturday) and 4 stations on day 2 (Sunday). Psychometric results were reviewed by subject matter experts after each exam and items or stations may have been removed from scoring due to procedural irregularities or content issues.
Each candidate who challenged the MCCQE Part II received two score reports – a SOR and a SIR. The SOR includes a total score, the pass score, and final result (e.g., pass, fail). The SIR provides the candidate with subscores in graphical format for the competency domains assessed by the exam.
Due to changes to the exam, the MCC reported total scores and pass scores on different scales over time. Table 3 describes the score scale, mean, SD, and the pass score for the MCCQE Part II that were implemented for different sets of exam sessions. The first column (Exam session) indicates different sets of exam sessions for each scale (e.g., October 2018-October 2019). The second column (score range) indicates the minimum and maximum total score for the scale. The third and fourth columns indicate the mean, SD, and pass score for the scale. The last two columns in Table 3 indicate how far a total score (in SD unit) is from the pass score established for a scale. The mean and SD were established using the candidate performance data at the time the scale was first implemented. They may vary over time with subsequent exam sessions.
Within each set of exam sessions, the MCCQE Part II total scores are equated across examination forms using statistical procedures. As a result, total scores are comparable across test forms, sessions and the same pass score is applied to candidates. However, scores cannot be directly compared between scales (e.g., between October 2018-October 2019 and May 2015-May 2018). This is because the implementation of the MCCQE Part II differed over time due to changes made to blueprint, content, format, and scoring approach. Nonetheless, an indicator of relative performance can be calculated by comparing total scores to the standard (i.e., the pass score) for the relevant period. As an example, a MCCQE Part II total score of 1 SD above the pass score 158 obtained during October 2018-October 2019 represents similar, relative performance to a score of 609 obtained during May 2015-May 2018. They are both 1 SD above their respective pass score.
Table 3. Score interpretation parameters for the MCCQE Part II
Exam session | Score range | Mean (SD) | Pass score | 1 SD above the pass score | 2 SDs above the pass score |
Oct. 2018 to Oct. 2019 | 50-250 | 150 (20) | 138a | 158 | 178 |
May 2015 to May 2018 | 50-950 | 500 (100) | 509b | 609 | 709 |
The MCCQE Part II score distribution falls along a wide range of the score scale. However, as with other MCC exams, it was designed to be most precise for total scores near the pass score to support a reliable pass/fail decision. Small score differences should not be over-interpreted as they may fall within the range of values that might reasonably arise because of measurement error.
The MCC cautions against comparing candidates based on small score differences and discourages using exam scores as the sole basis for selection decisions.
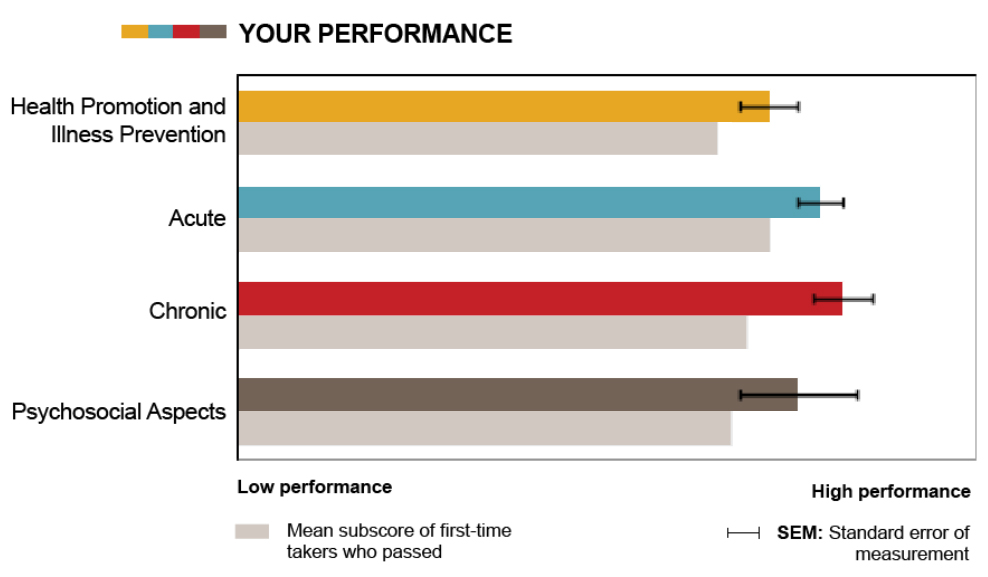
Additional information about domain subscores in various competency domains is provided in the SIR for each exam. Note that the subscores as reported in the SIR should not be used to compare candidates’ performance. They are provided to candidates, in graphical format, as formative feedback on their relative strengths and weaknesses and compare their subscores with the mean subscores of first-time test-takers who passed the exam. The subscores are based on significantly less data and do not have the same level of precision as the total score. Please refer to the sample graph in the Figure for interpreting the SIR. Different exams may assess different competency domains but how the interpretation of the information provided in the SIR is similar across exams.
The Therapeutics Decision-Making (TDM) Examination aims to assess the competence of candidates at the level required of a family physician practicing independently and safely in Canada. The content is developed by the MCC, and the examination is administered by the MCC on behalf of the PRA programs for use in the selection of candidates into PRA programs. It consists of patient-based scenarios representing common or important clinical presentations and problems that family physicians practicing in Canada should be able to competently manage in the following dimensions of medical care: health promotion and illness prevention, acute illness, chronic illness and safety and adverse effects.
The examination is comprised of 40 cases with approximately 100 short answer write-in questions. Candidates are allowed up to three hours to complete the examination.
The TDM Examination is a criterion-referenced assessment; therefore, only pass/fail result is released to the programs.
Between 2018 and 2020, the TDM Examination was a paper-based test administered by PRA programs. Since October 2020, the TDM Examination is offered as a computer-based test in Prometric test centers across Canada and worldwide, as well as through remote proctoring.
Five considerations for use and interpretation of MCC exam scores for PRA programs:
1021 Thomas Spratt Place
Ottawa, ON Canada, K1G 5L5
T : 1-613-521-6012
F : 1-613-248-5234
E : [email protected]